B-18 TI-85/TI-86 Graphing Calculators
Copyright © Houghton Mifflin Company. All rights reserved.
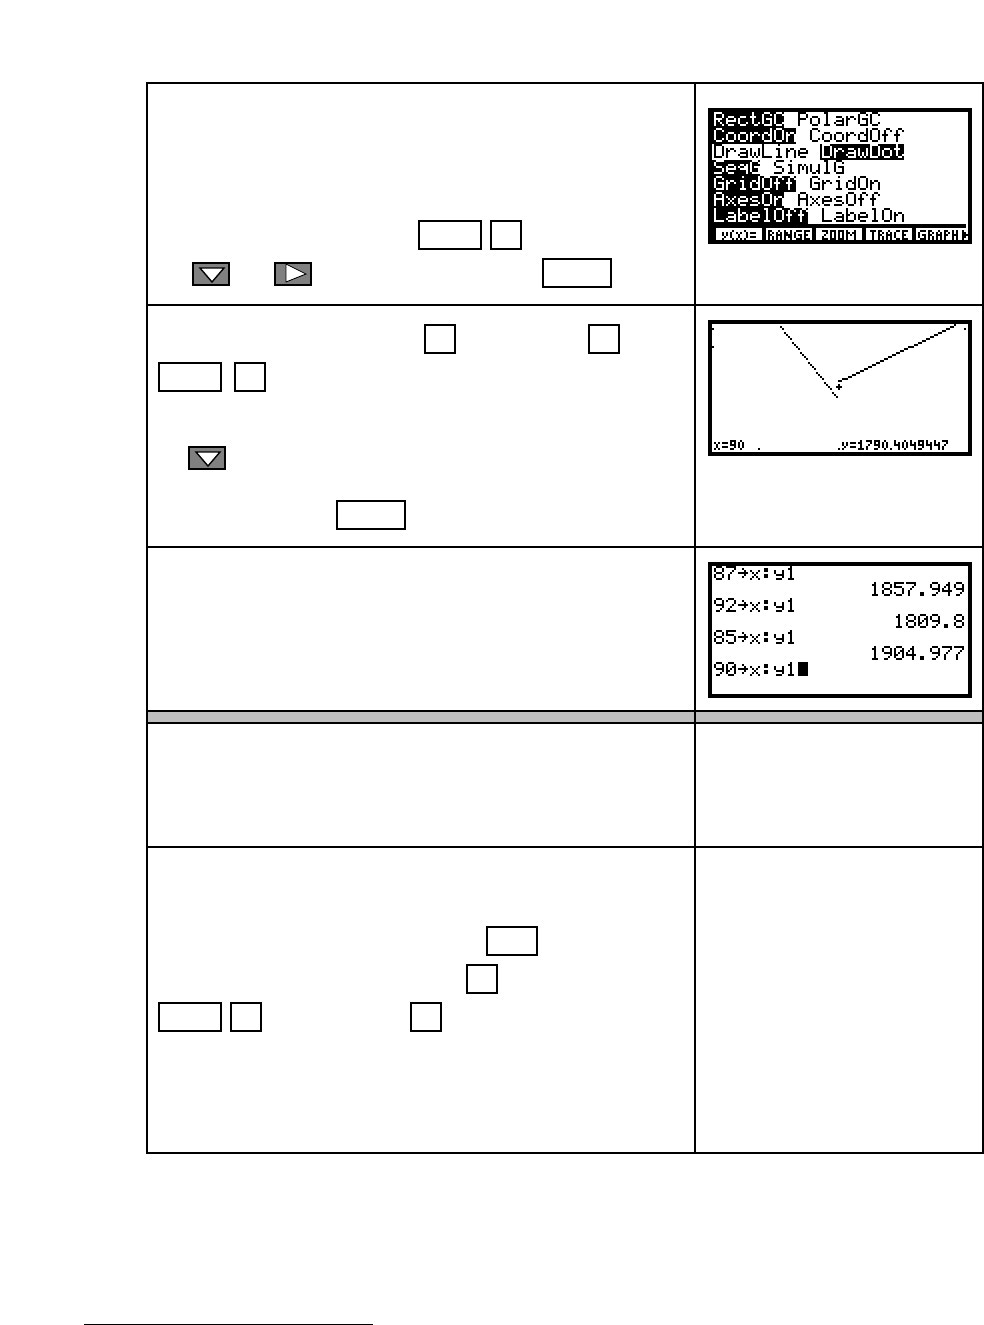
Because the two pieces are close together at x = 90,
you may need to take a closer look to see the break.
However, because the calculator draws graphs by
connecting function outputs wherever the function
is defined, it will connect the two pieces unless you
tell it not to do so by pressing MORE F5 (FORMT) ,
use and to choose DrawDot. Press ENTER .
Now, take a closer look with F5 (GRAPH) and F3
ZOOM F2 (ZIN ) .
To keep the point where the functions break in view,
use to move the small cursor that appears in the
middle of the screen down to where the two functions
join before pressing ENTER to actually zoom in.
The breaks you see in the left
portion of the function are
because you are in dot mode.
TI-85 You can find function values by evaluating out-
puts on the home screen or using the table.
Do not forget to change the calculatorÕs FORMAT
setting back to DrawLine when you finish graphing
the piecewise function.
TI-86 The same procedure as given in the above steps
will also work for the TI-86. However, the TI-86 has
some additional features that make graphing of piece-
wise functions less complicated.
(See Section 6.1.2 of this
Guide for an example
showing how to fit a
piecewise model to data.)
Instead of going to the FORMAT menu, use the follow-
ing to choose DrawDot.
Have the cursor on the y1 line, press EXIT until you return
to the graph menu, and then press F1 (y(x)=)
MORE F3 (STYLE) . Press F3 five more times
to choose the dotted line
2
to the left of y1.
The dotted line you now see to the left of y1 indicates
the graph will draw without joining the outputs of
the function.
2
The different Ògraph stylesÓ you can draw from this location are described in more detail on page 10 in your
TI-86 Graphing Calculator Guidebook.
