GNC 420(A) Pilot’s Guide and Reference
11-35
SECTION 11
ADDITIONAL FEATURES
190-00140-20 Rev. K
Ceiling and Visibility - Flight Rules
VFR
(green bars)
Marginal VFR
(green bars)
IFR
(yellow bars)
Low IFR
(yellow bars)
Table 11-15 Ceiling and Visibility Graphics
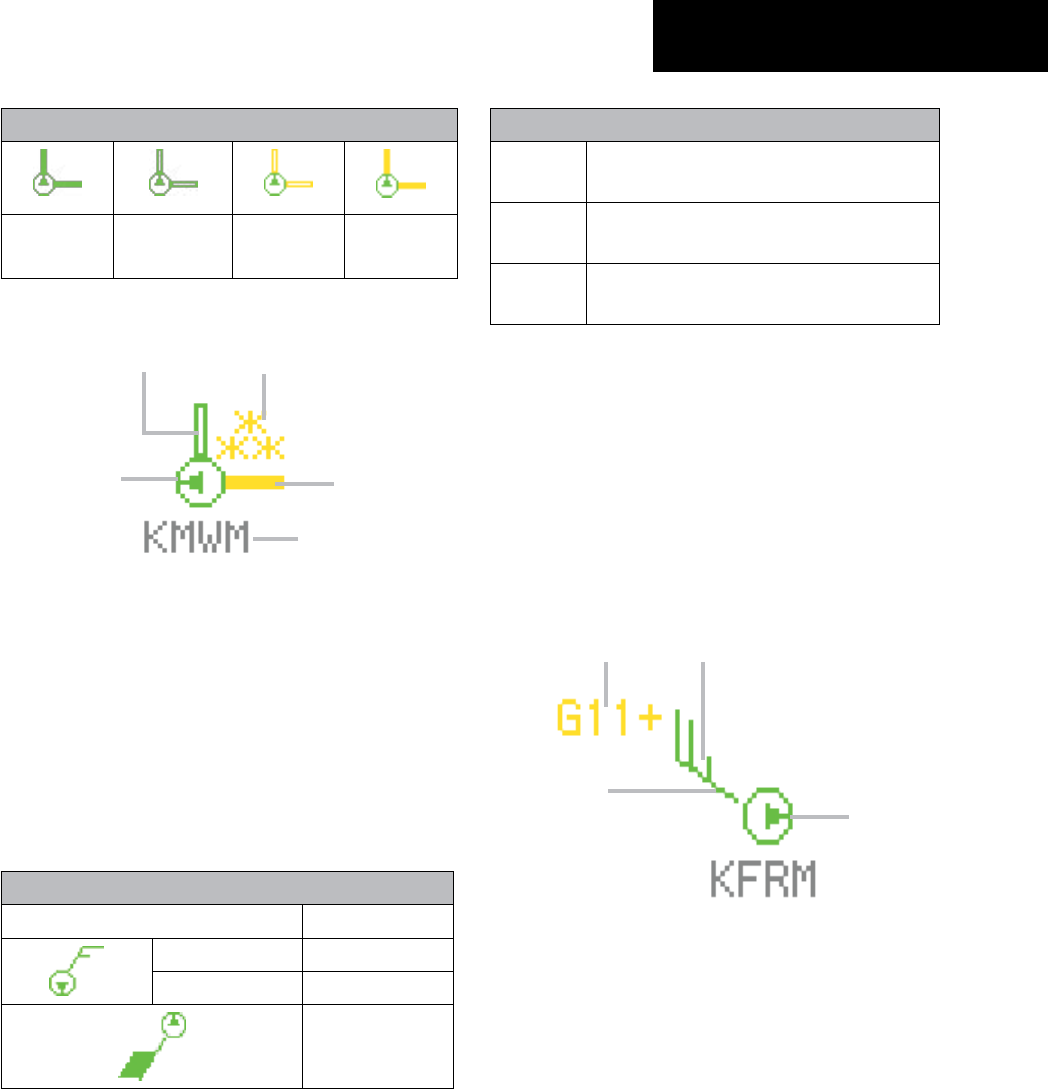
Ceiling
Precipitation
Visibility
Station Identifier
Data Age
Figure 11-48 METAR Symbol
Winds
Wind Vector - The wind vector indicates the
direction of the surface wind to the nearest 30˚
increment (e.g. 30˚, 60˚, 90˚, 120˚, etc.).
Wind Speed - In general, the sum of the wind barbs
(see Table 11-16) is the sustained surface wind
speed.
Wind Speed
(Blank) Unknown
Short Barb 5 kts
Long Barb 10 kts
≥ 37 kts
Table 11-16 Wind Speed Graphics
Gust Offset
(Blank) Gusts are unknown or < 5 kts above
sustained wind speed.
G10
(Green)
Wind is gusting 5 - 10 kts more than
sustained speed.
G11+
(Yellow)
Wind is gusting 11 kts or more above its
sustained speed.
Table 11-17 Gust Offset Graphics
To interpret wind speed, add the values of each of the
wind speed barbs. In Figure 11-49, there are two long
barbs (10 knots each) and one short barb (5 knots each).
Thus, the total wind speed is 25 knots. Adding the gust
offset to this gure gives winds gusting to 36 knots. Thus,
the symbol in Figure 11-49 indicates the surface wind at
KFRM is coming from a direction of 300° at a speed of
25 knots, gusting to 36 knots or greater. The data age is
11-20 minutes old.
Gust Offset
Wind Speed
Wind Vector
Data Age
Figure 11-49 Wind Symbol
Temperature - Dewpoints
The Temperature-Dewpoint Range symbols (Table
11-18) display the difference between the reported
temperature and dewpoint. Differences are shown in
degrees Fahrenheit.


