Getting Started With the Web Interface
20
5.3.3 View Sensor Graphs
The OpenComms EM sensor data may be viewed in graphic format, along with the sensor’s upper and
lower alarm limits, as described in 5.3.1 - Configure Sensors.
The OpenComms EM stores up to 1,440 data samples for each sensor. Sensor data samples can be
stored at intervals of 1 minute, 5 minutes, 10 minutes or 15 minutes. (To change the data sample
rate, see 5.7.3 - Data Presentation.)
These sample rates correspond to 24 hours of data samples collected at 1-minute intervals, 5 days for
5-minute intervals, 10 days for 10-minute intervals and 15 days for 15-minute intervals.
Sensor data samples are lost when the sensor is disconnected from a port or when the unit is shut
down or loses power. You can use SNMP to sample sensor data at a different rate or to store larger
amounts of data. (To activate SNMP traps, see 5.5.3 - SNMP Trap Alerts Setup. To set up SNMP
properties, see 5.7.2 - SNMP Information.)
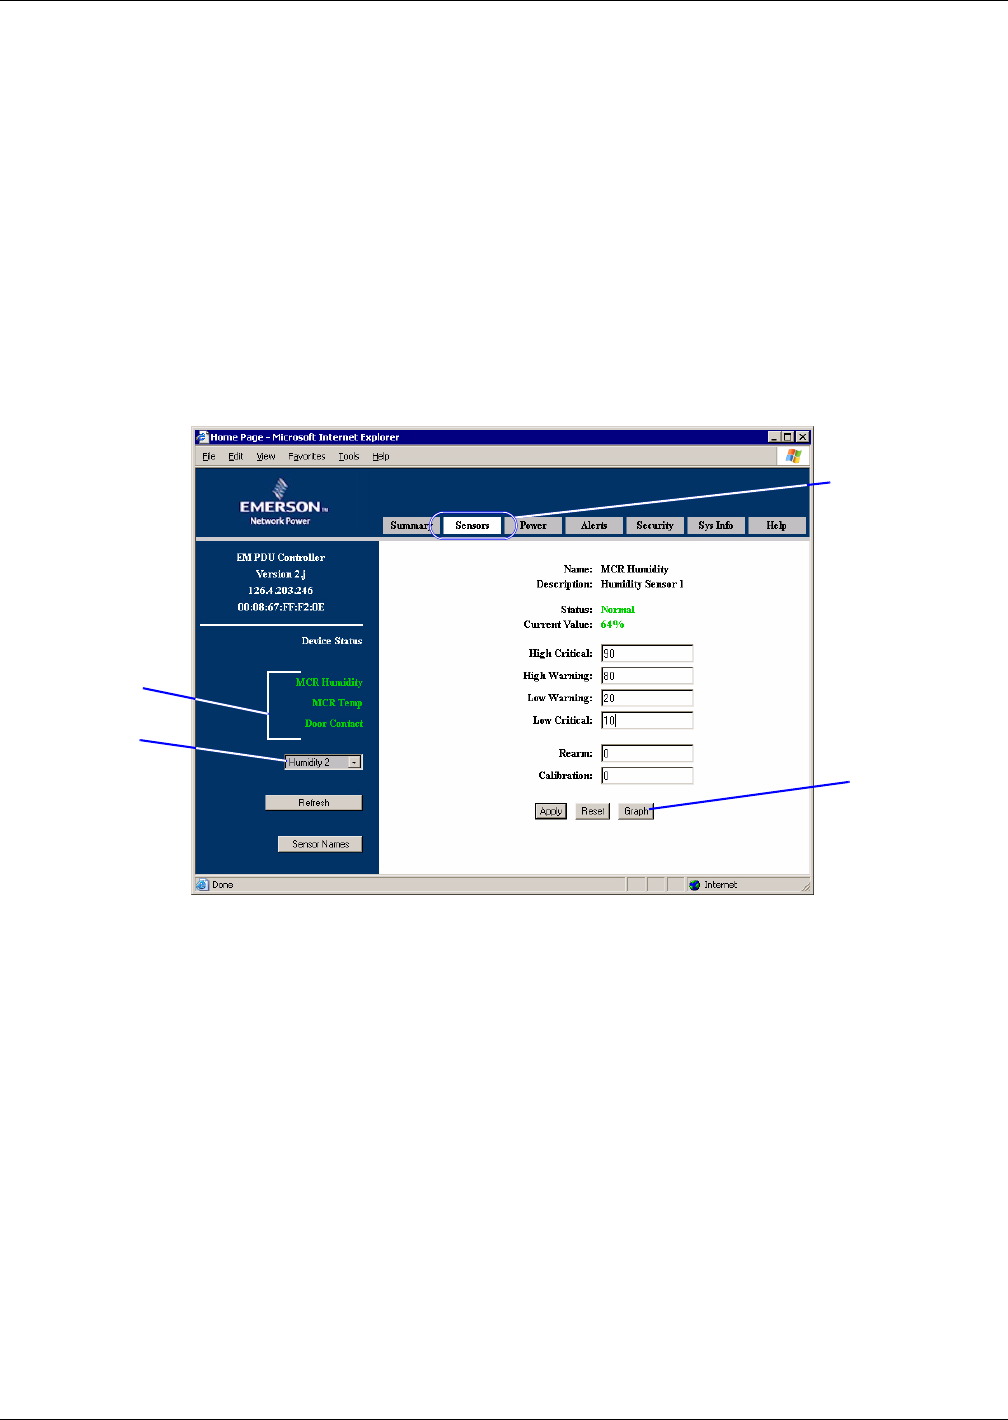
To access the Sensor Graphs window, log in (see 5.1 - Open the Web Interface and Log In) and:
• Click on the Sensors tab at the top of the Web interface, as shown below.
• Choose a sensor from either of two lists on the left side of the window, as shown above:
a. Click on a link in the connected sensors list, or
b. Click on the Down arrow to the right of the drop-down list and select a name from the list.
• On the right side of the window, click on the Graph button, as shown above. The right side of the
window shows a graph of current sensor data, upper and lower limits, as in the example in
Figure 6.
Sensors tab
Graph
button
a. Connected
sensors list
OR
b. Drop-down
list
Select a sensor
from either list:


