12 Rockwell Automation Publication 1412-UM001D-EN-P - September 2012
Chapter 1 Product Features
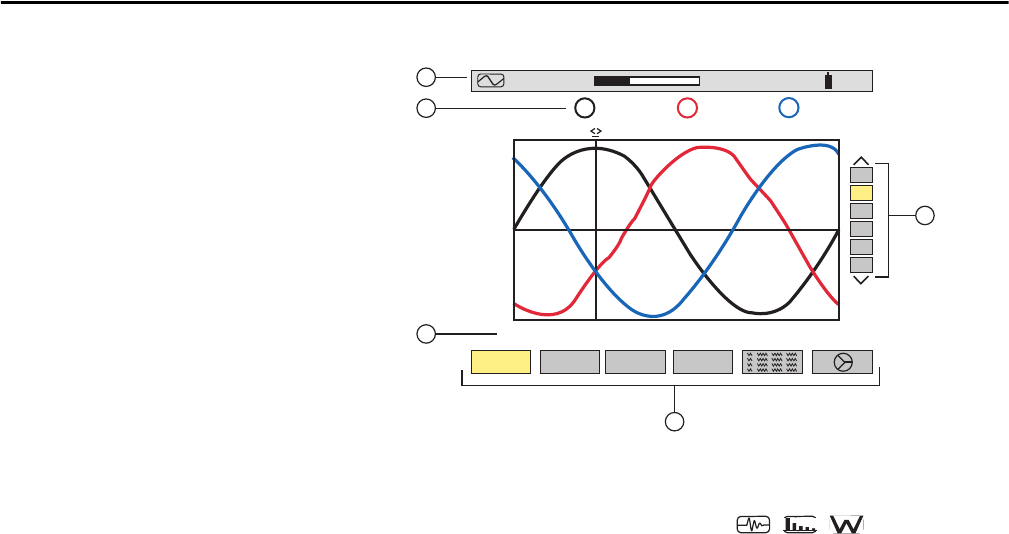
Display
Top display bar indicates:
• Symbol of the tested mode (for example, , , ).
• Frequency of measured signal.
• Memory capacity status bar (only available in certain modes).
• Current date and time.
• Battery charge status.
Measured RMS values associated with waveforms.
Values of signals at an instant, t, at the intersection of cursor and the
waveforms. The cursor can be moved along the time scale by pressing the
left/right cursor buttons.
Measurement selection:
• RMS - True RMS Measurement.
• THD - Total Harmonic Distortion.
• CF - Crest Factor.
• max/min - Maximum and Minimum values.
• Simultaneous display of the various measurements in alphanumeric form.
• Phasor diagram.
Selection of waveforms to be displayed (use the Up/Down Cursor buttons
to select):
• 3U displays the three phase-to-phase voltages U1-2, U2-3, U3-1.
• 3V displays the three phase-to-neutral voltages V1N, V2N, V3N.
• 3A displays the three phase currents.
• 4A displays the three phase currents and the neutral current.
• L1, L2 or L3 displays the voltage and current, on phase 1, 2 or 3, when
selected.
300V
RMS
0
-300
<t= 5.0ms V1= +276 V2= -140V3= -145>
3U
3V
3A
L1
L2
L3
THDCF
max
min
5
2
1
3
4
202.5 v202.0 v202.7 v
123
07/25/0249.99Hz 10:26 100
%


