46 Rockwell Automation Publication 1412-UM001D-EN-P - September 2012
Chapter 3 Display Modes
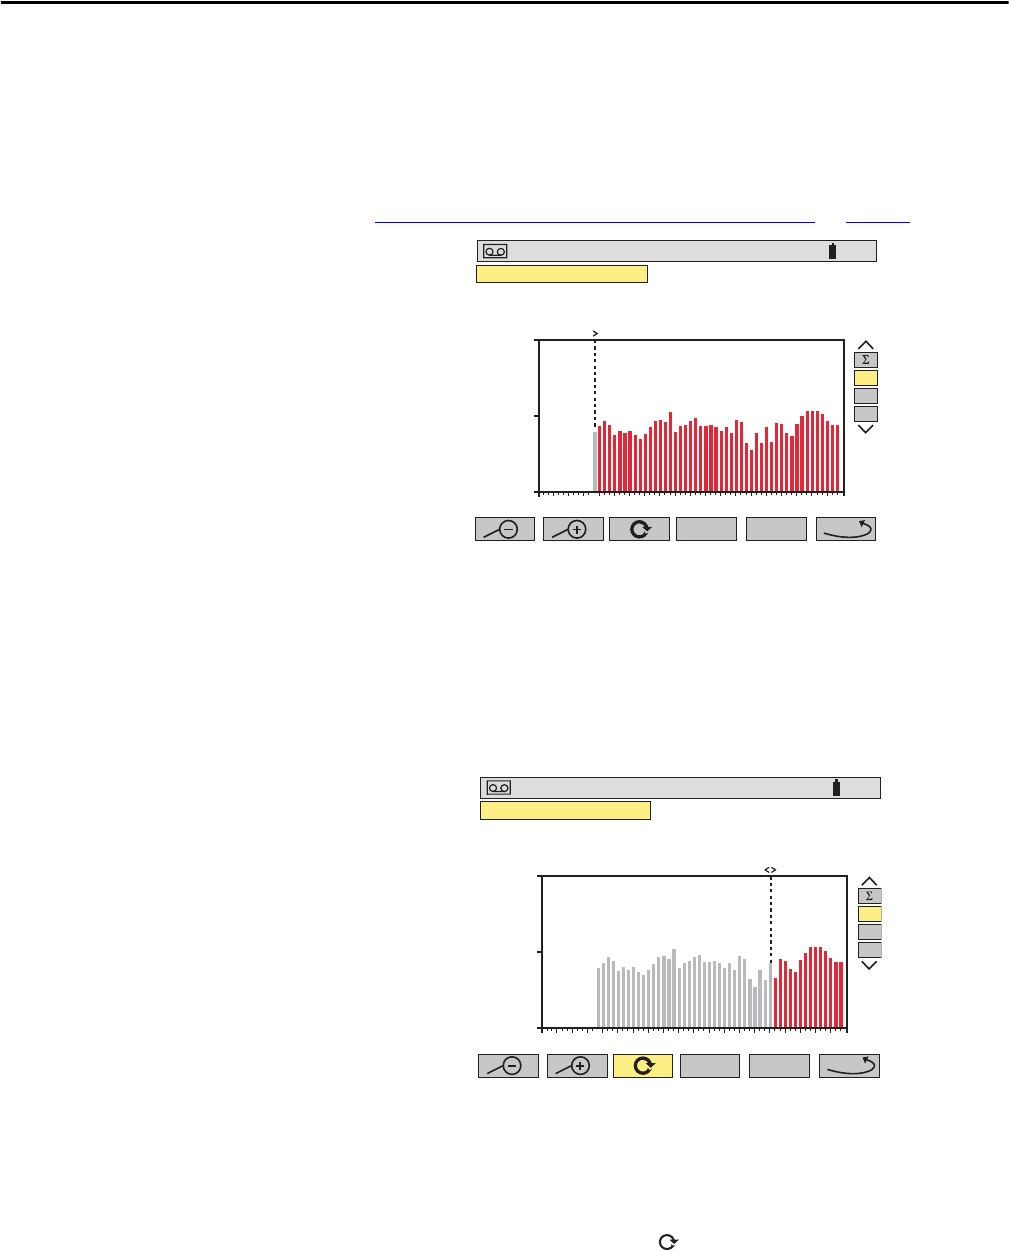
Graphic Display of Average Power
After returning to the Measurement Selection Screen use the ../.. button to view
more recorded parameters, if necessary. Pressing the W button, brings up a screen
similar to the following.
See Select a Graphic Display for Recorded Measurements
on page 44.
In the example above, the display shows the average value of the real power on the
phase L1. The value is updated as the cursor is moved with the Left/Right Cursor
buttons.
Energy Measurement for a Determined Period
The energy over a selected period can be calculated from the average power
records.
1. Move the cursor to the start time.
2. Press the Start function button .
3. Move the cursor with the left and right cursor buttons to the desired end
time.
4. The energy value is displayed, with end date and end time.
Hold the cursor button down to switch to fast forward.
+4000
+3900
+3800
mn> 10 15 20 25 30
+3.881
kW
L1
L2
L3
07/25/02 10:38 100
%
07/25/02 10:13:21
+4000
+3900
+3800
mn> 10 15 20 25 30
+755.2
Wh
L1
L2
L3
07/25/02 10:39 100
%
07/25/02 10:25:21


