GPSMAP 5000 Series Owner’s Manual 55
uSInG Xm WX Weather and audIo
usInG Xm
Viewing Forecast Information
Forecasts show the weather conditions including fronts and precipitation. To view the forecast
for another time period, touch Next Forecast. The forecasted weather for the next 12 hours is
shown. Continue to touch Next Forecast to view forecasts for the next 24, 36, and 48 hours. To
view forecast information for another location, touch and drag the screen until the desired location
appears.
Understanding Fronts
The Fronts show lines indicating the leading edge of an air mass. This feature also shows pressure
centers. Pressure centers are represented by a large Red “L” for low pressure centers or a large Blue
“H” for high pressure centers. Pressure centers represent an area where pressure is measured to be
either the highest or lowest relative to the surrounding area.
Cold Front
Warm Front
Stationary Front
Occluded Front
Trough
Indicates a Low Pressure Center. A Low Pressure Center is an area where the measured
pressure is lowest relative to the surrounding area. Moving away from a Low Pressure
Center in any horizontal direction results in increased pressure. Winds ow
counterclockwise around Low Pressure Centers in North America.
Indicates a High Pressure Center. A High Pressure Center is an area where the measured
pressure is highest relative to the surrounding area. Moving away from a High Pressure
Center in any horizontal direction results in decreased pressure. Winds ow clockwise
around High Pressure Centers in North America.
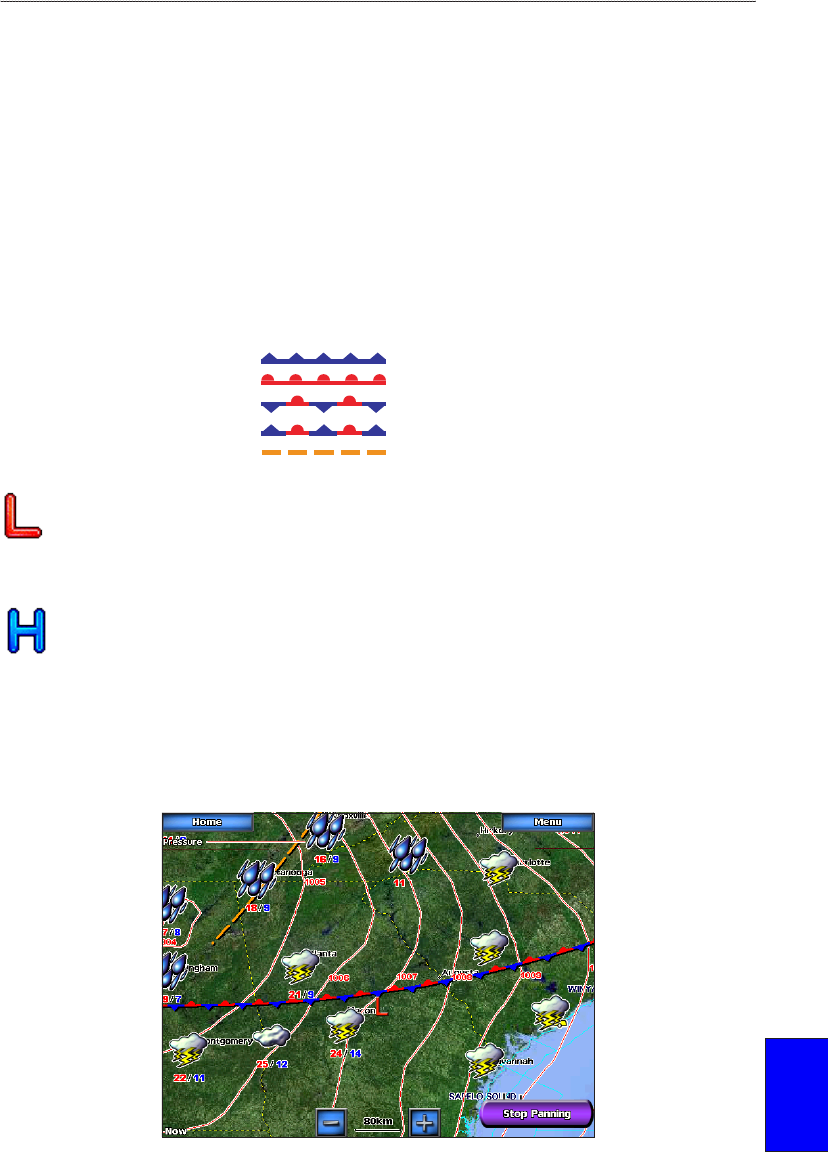
Understanding City Forecasts
City forecasts appear as standard weather symbols. The forecast is viewed in 12-hour increments for
the next 48 hours.


