ZENworks® ESM 3.5 Administrator’s Manual 221
Troubleshooting SQL Server Issues
System Monitor
System Monitor is a MMC snap-in that lets you view real-time performance data contained in the
counters from your server or other servers or workstations on your network. In addition, System
Monitor allows you to review performance data that is stored in a log file created with
Performance Logs and Alerts snap-in.
Windows 2000 and Windows 2003 are modular, object-oriented operating systems. Each
subsystem within the operating system is an object. For example, the CPU is an object, the
memory is an object and the storage subsystem is an object. As the server performs various tasks,
each of these objects generates performance data.
Each object has several monitoring functions called counters. Each counter offers insight into a
different aspect or function of the object. For example, the memory object has counters that
measure % Committed Bytes in User and Available Bytes, Page Faults/sec. System Monitor takes
the readings from these counters and presents the information to you in a human readable format
(numbers or graphs.)
In addition, objects can be separated by instance. Instance is the terminology used to refer to
multiple occurrences of the same type of object, such as in a multiprocessor server. A separate
instance exists for each processor.
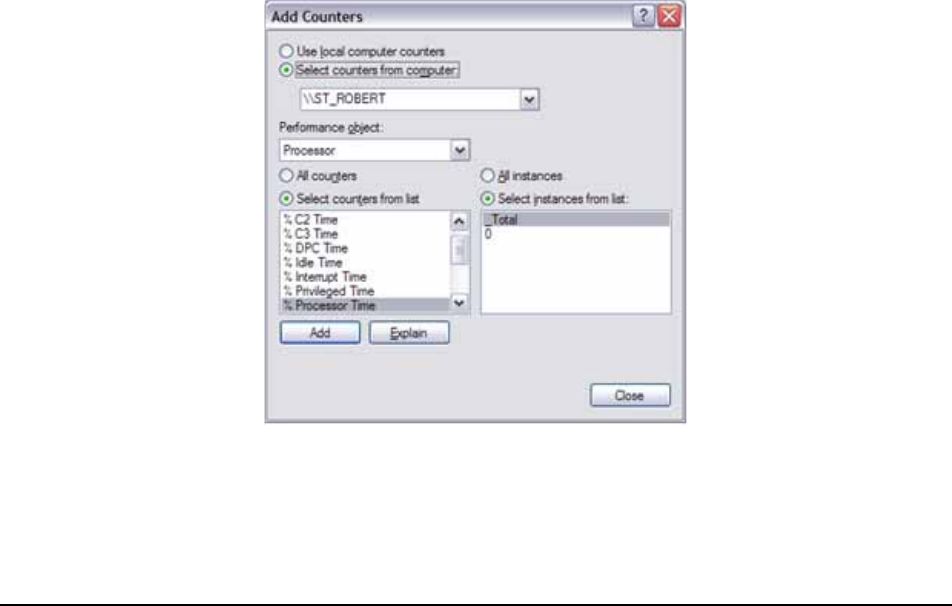
By default, System Monitor is started without any counters displayed. To add counters to be
monitored, click the "+" button on the System Monitor menu bar. This opens the Add Counters
dialog box shown below (see Figure 110).
Figure 110 : Add Counters Dialogue Box
In the Add Counters dialog box, you can make choices from several areas to customize your
monitoring needs. The choices found on this dialog box are as follows:


