Displaying Indicators
208 PATROL DashBoard User Guide
■ the print and export controls (upper right)
You can print the graph in either of two sizes by clicking the print control button
and then selecting a printer or a file to which to send the image. You can export the
data that makes up the graph by clicking the export control button and then
choosing
File => Save As and specifying a file name.
To return to normal display mode, click the at the top right of the graph. If you
have a graph displayed in full-page mode and then click another object in the
navigation tree at the same level, the same indicator for the new object is displayed in
full-page mode, so you can easily scan through all of the objects at a particular level to
visually compare the values for a single indicator.
Changing the Time Period for Displayed Indicators
You can view the indicator data for any period of time for which data is available. Use
the
Hour, Day, Week, Month, and Year buttons to reset the time. When you click one of
these buttons, the and arrows are displayed around it. Clicking the arrow
displays the graph for the previous time period designated by the button. Clicking
the arrow displays the graphs for the following time period designated by the
button.
5-Minute Interval Data
To view the graph of data collected every five minutes, click the Hour button. The
reports for the current date and time are displayed.
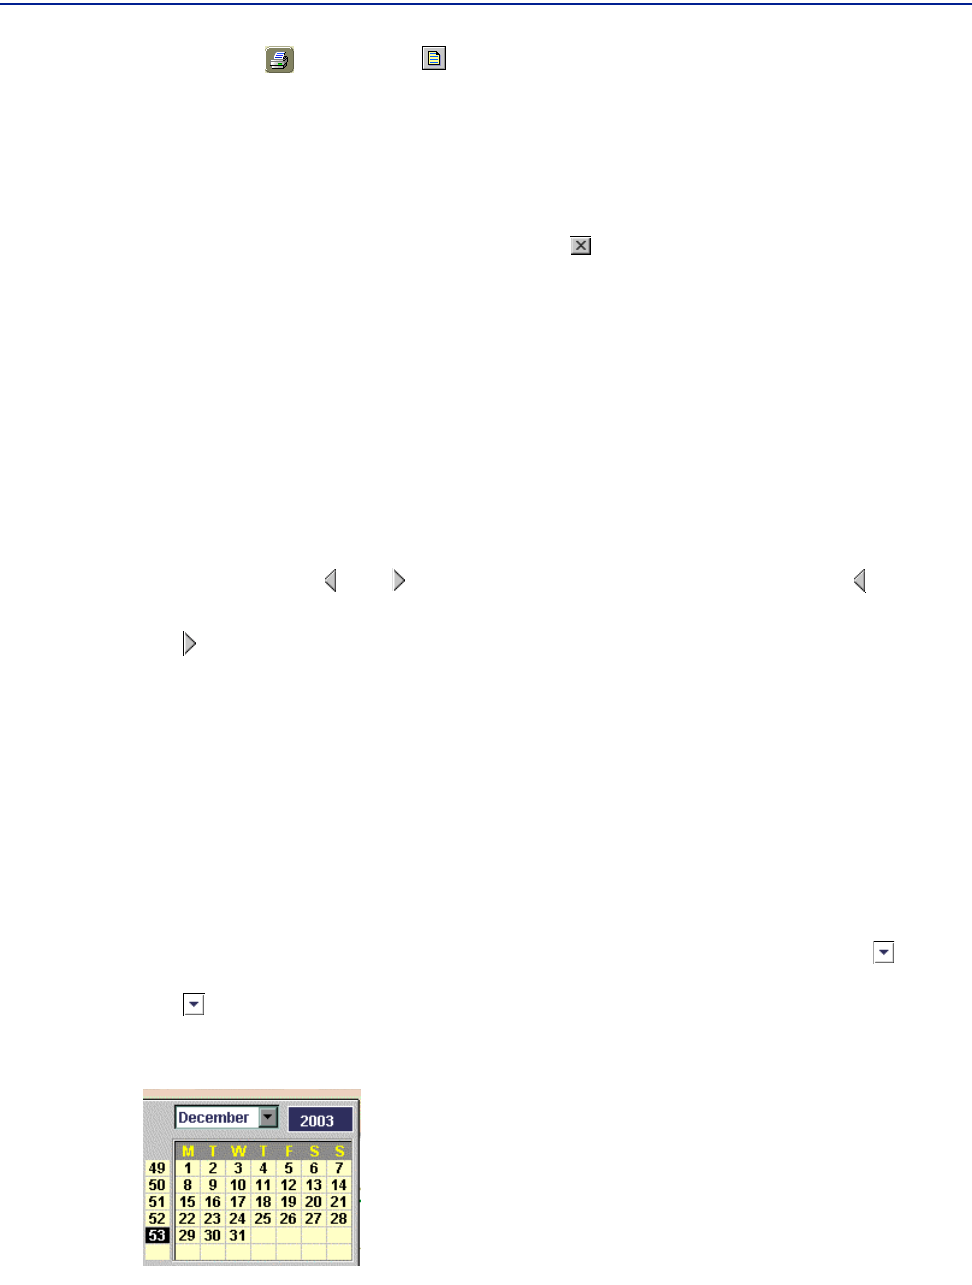
Daily Data
To view the graph for a particular date from the last three months, click the button
on the
Day button and select the day from the calendar, as shown in Figure 120. Click
the button on the calendar to select the month.
Figure 120 Daily Calender


