


Chapter 4 91
Overview of the Test Set’s Built-In Tools
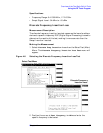
Using the RF Tools Program
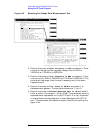
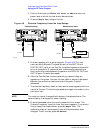
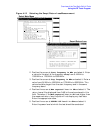
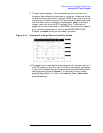
9. The trace of the cable loss over the frequency range swept is
displayed. The average loss is also displayed on the screen. To save
the plot to a PC card, press
k4
(Save Plot) and use the knob to enter
a filename. Press
k5
(Scr Dump) to send the image to a printer or to
the BTS Laptop Utility. Directions will appear at the top of the
screen. Press PRINT and allow the image to print to the connected
device. Then, press PAUSE/CONTINUE. Press
k1
(Proceed) when
you are ready to proceed
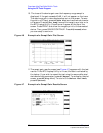
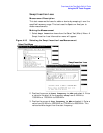
10.The swept insertion loss results screen appears with the test results.
If the BTS Laptop Utility is in use, this data is collected by the
laptop. If you wish to repeat the test using the same calibrated
devices and test parameters, press
k1
(Repeat). To redisplay the plot
screen, press k3(Disp Plot). To return to the Select Test (Main)
Menu, press
k5
(Return).
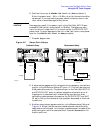
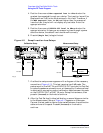
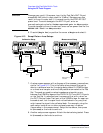
Estimating Swept Insertion Loss Using a Single Connection
Rather than directly measuring the transmitted signal (requiring
connections at both ends), a known high-quality short can be put at the
end of the cable. Knowing that this will reflect 100% of the signal, the
Swept Return Loss test (page 92) can be used and the measured return
loss in dB can simply be divided by 2 to get the system’s estimated
insertion loss. If the return loss is not in dB, the square root of the
measurement would be the system’s insertion loss. An open can also be
used instead of a short, but the results will not be as precise.
Specifications
• Frequency Range: 0.4-1000 MHz, 1.7-2.0 GHz
• Swept Signal Level: -54 dBm to +10 dBm
• Insertion Loss Accuracy: +/- 0.75 dBm