


Chapter 4 95
Overview of the Test Set’s Built-In Tools
Using the RF Tools Program
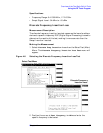
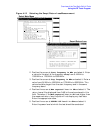
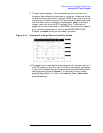
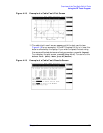
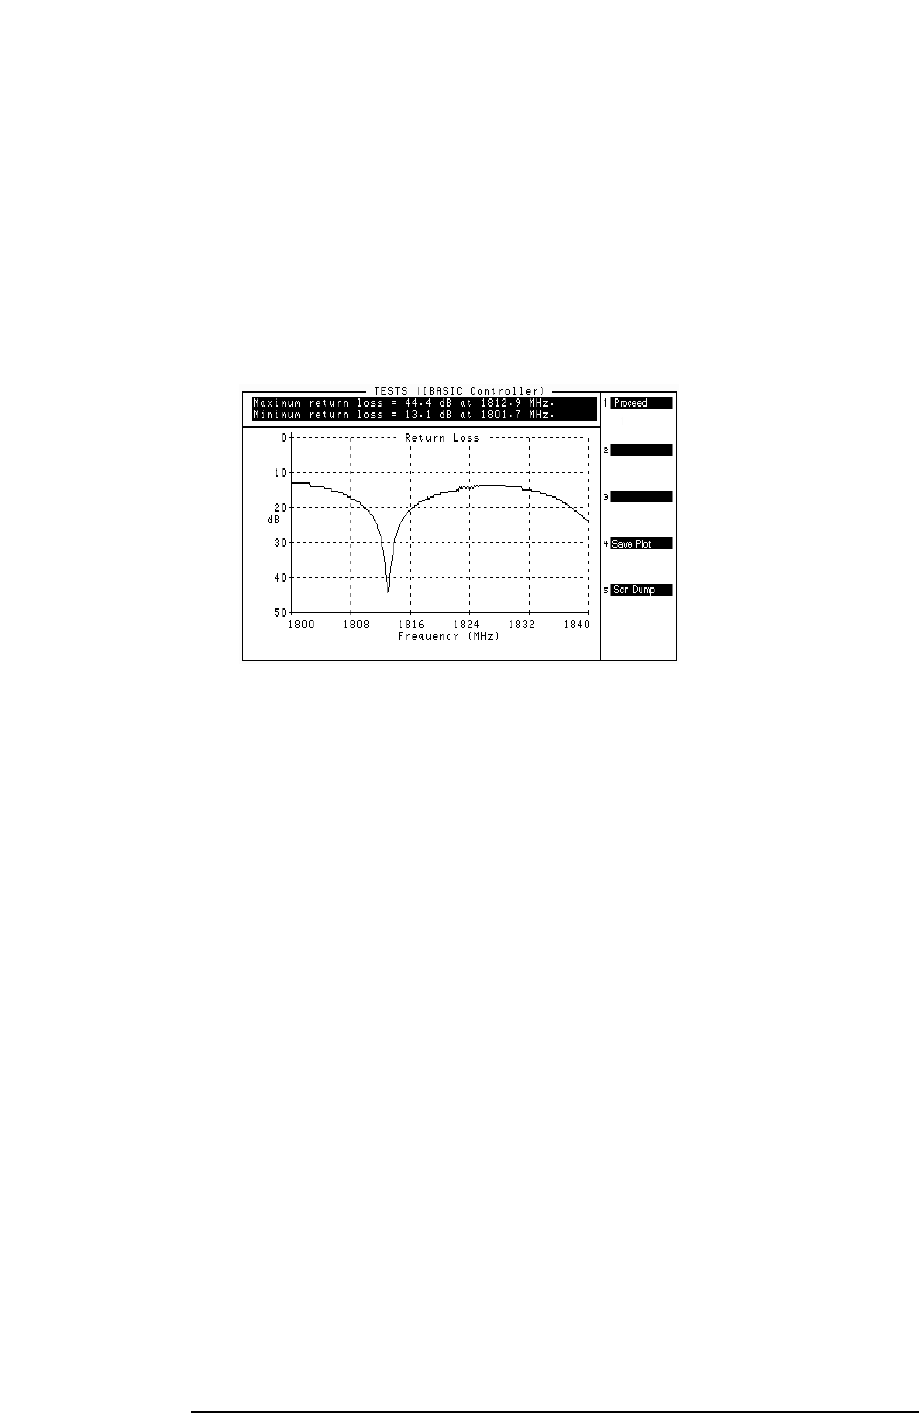
9. The plot screen appears. The trace showing return loss over the
frequency band selected is displayed on the screen. Measured values
for best and worst case return loss and VSWR are printed at the top
of the screen. To save the plot to a PC card, press
k4
(Save Plot) and
use the knob to enter a filename. Press
k5
(Scr Dump) to send the
image to a printer or to the BTS Laptop Utility. Directions will
appear at the top of the screen. Press PRINT and allow the image to
print to the connected device. Then, press PAUSE/CONTINUE.
Press
k1
(Proceed) when you are ready to proceed.
Figure 4-14 Example of a Swept Return Loss Plot Screen
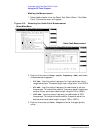
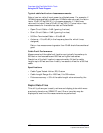
10.The swept return loss results screen appears with the test results. If
the BTS Laptop Utility is in use, this data is collected by the laptop.
If you wish to repeat the test using the same calibrated devices and
test parameters, press
k1
(Repeat). To redisplay the plot screen,
press
k3
(Disp Plot). To return to the Select Test (Main)Menu,
press
k5
(Return).