


12
482 Nokia Network Voyager for IPSO 4.0 Reference Guide
Generating Monitor Reports
You can generate reports of data collection events. To generate a report, click the link for the
appropriate report under Monitor > Reports in the tree view.
For information on configuring monitor reports, see “Configuring Monitor Reports” on page
177. The administrator can configure how often the data is collected, whether each data
collection event is enabled or disabled, and how many hours worth of collected data are stored
on the system.
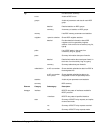
Table 31 Reports
Report Description
Rate-Shaping Bandwidth Shows specific bandwidth utilization. You can use traffic shaping to
implement a specific policy that controls the way data is queued for
transmission. For information on creating aggregate classes and configuring
traffic rules, see Chapter 10, “Configuring Traffic Management.”
Inclusion of number of packets delayed and bytes delayed is configurable by
the administrator. By default, both are included.
Interface Throughput Shows historical throughput for each interface.You can often use this
information to optimize network performance or troubleshoot issues network
traffic congestion.
Inclusion of packet throughput, byte throughput, broadcast packets, and
multicast packets for each interface is configurable by the administrator. By
default, all are included.
Network Throughput Similar to the interface throughput report, except that the query is based on
the network address rather than interface name.
Interface Link State Shows information about the link state of each interface. The first signs of
problems with interfaces is frequently seen in link errors. You can use this
report to determine if an interface is experiencing problems or has been
incorrectly configured.
CPU Utilization Shows historical CPU utilization data, including percentages of CPU time for
each of the following:
•User% —Percentage of CPU time spent in User-level instructions.
• Nice%—Percentage of CPU time spent in "Nice" processes.
•System%—Percentage of CPU time spent in System level instructions.
•Interrupt%—Percentage of CPU time spent in servicing interrupts.
•Idle%—Percentage time CPU was idle.
Memory Utilization Shows historical memory utilization, including:
• Active Real Memory—Kilobytes of real memory being used in a given
time interval.
• Free Real Memory—Kilobytes of real memory free in a given time
interval.