


Nokia Network Voyager for IPSO 4.0 Reference Guide 483
To display reports
1. Click the name of the report under Monitor > Reports in the tree view.
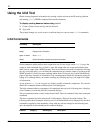
2. Under Select Report Type, select one of the following:
Hourly—Hourly report with a 1-hour display up to a maximum of 7 interval day data.
Daily—Daily report with 1-day display interval up to a maximum of 35 day data.
Weekly—Weekly report with 7-day display interval up to a maximum of 52 weeks.
Monthly—Monthly report with 1-month display interval up to a maximum of 60
months.
Detailed Search—Select a specific time period. These reports have a default data
interval of one minute. The number of hours worth of data stored for detailed searches is
configured by the administrator. For more information, see “Configuring Monitor
Reports” on page 177.
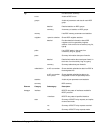
3. For the Rate-Shaping Bandwidth report, select an aggregation class for which you want to
display a report or select All Aggregates to display data for all configured aggregation
classes.
Note
You must configure an aggregation class and associate it with an access control list for
the name to appear as a choice in the Aggregation Class list. For more information, see
Chapter 10, “Configuring Traffic Management.”
4. For the Interface Throughput, Network Throughput, or Interface Link State reports, select
All Logical or a specific interface name from the Select Interface drop-down list.
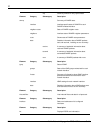
5. Under Select Format, choose Graphical View or Delimited Text.
If you select Delimited Text, select Semi-Colon(;), Comma(,), or Tab from the Delimiter
drop-down list.
The Graphical View option displays pie and graph charts, as well as in table format. The
Delimited Text option displays the report in a new page from which you can download the
information.
6. Click Apply.
Monitoring System Health
The system health links allow you to display statistics to help you monitor the status of your IP
security platform. To view this information, click the appropriate link under Monitor > System
Health in the tree view.
Useful System Statistics—Summarizes configuration information, including the following:
Active Routes—The number of active routes configured.
Packets Forwarded—The number of packets forwarded.
VRRP Masters—The number of VRRP masters configured.